OrcaViz provides it’s product in two flavours:
- OrcaViz-LM (Local Maps) is a Microsoft Certified version of OrcaViz. It provides assurance for users that Microsoft has reviewed the application at a source code level and are satisfied that it meets their requirements for security. However, these stringent requirements mean that some functionality, such as fully zoomable maps and 3rd party geocoding cannot be included because that would require an external data connection.
- OrcaViz-Pro has the same functionality as OrcaViz-LM but includes full mapping, a choice of map layers and external geocoding.
Whichever product you choose, each has the same tiered pricing structure. OrcaViz-Pro and LM are Power BI Custom Visuals with 3 subscription levels.
- OrcaViz-Pro/LM-500 Starter is free and fully functional but limited to the display of 500 data points. This is suitable for smaller datasets and enables users with larger datasets to experience the product before upgrading to one of the paid tiers.
- OrcaViz-Pro/LM-10k has the same functionality as Pro/LM-500 but has an increased limit of 10,000 data points.
- OrcaViz-Pro/LM-30k has the same functionality as Pro/LM-500 but has an increased limit of 30,000 data points.
In order to show data on the map, OrcaViz requires the data to include latitude and longitude coordinates. If the data doesn’t have the coordinates, the OrcaViz custom visual provides functionality to add latitude and longitude to the data in a process called “geocoding”. This can be achieved using the OrcaViz built-in geocoder (in both products), or using Microsoft’s Azure Maps geocoding API (In OrcaViz-Pro). Using the Azure Maps geocoder will require an API key from Microsoft. This can be obtained (free of charge in many cases) from Microsoft.
Key Functionality
All OrcaViz-Pro/LM subscription tiers provide the following functionality:
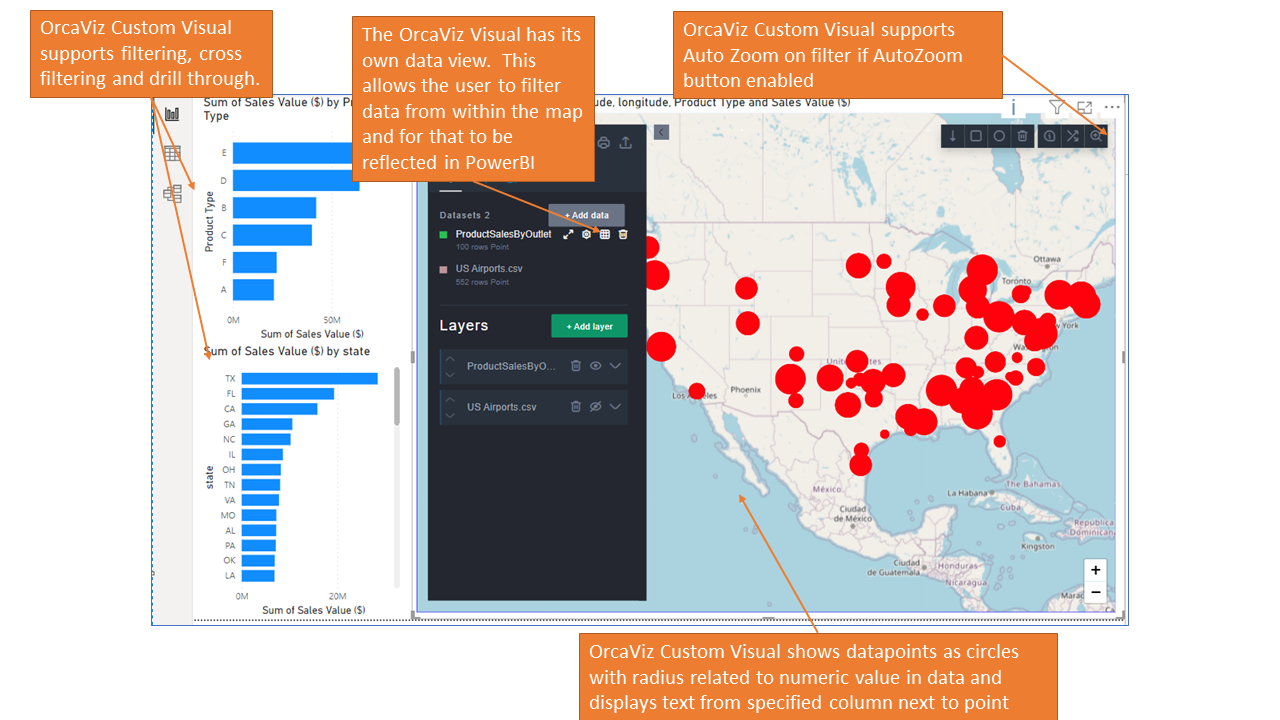
- Circle visualisation, with sizing based on a numeric value in the data and user defined colours
- Pin visualisation with a selection of pin icons
- Ability to add text to pins or circle icons
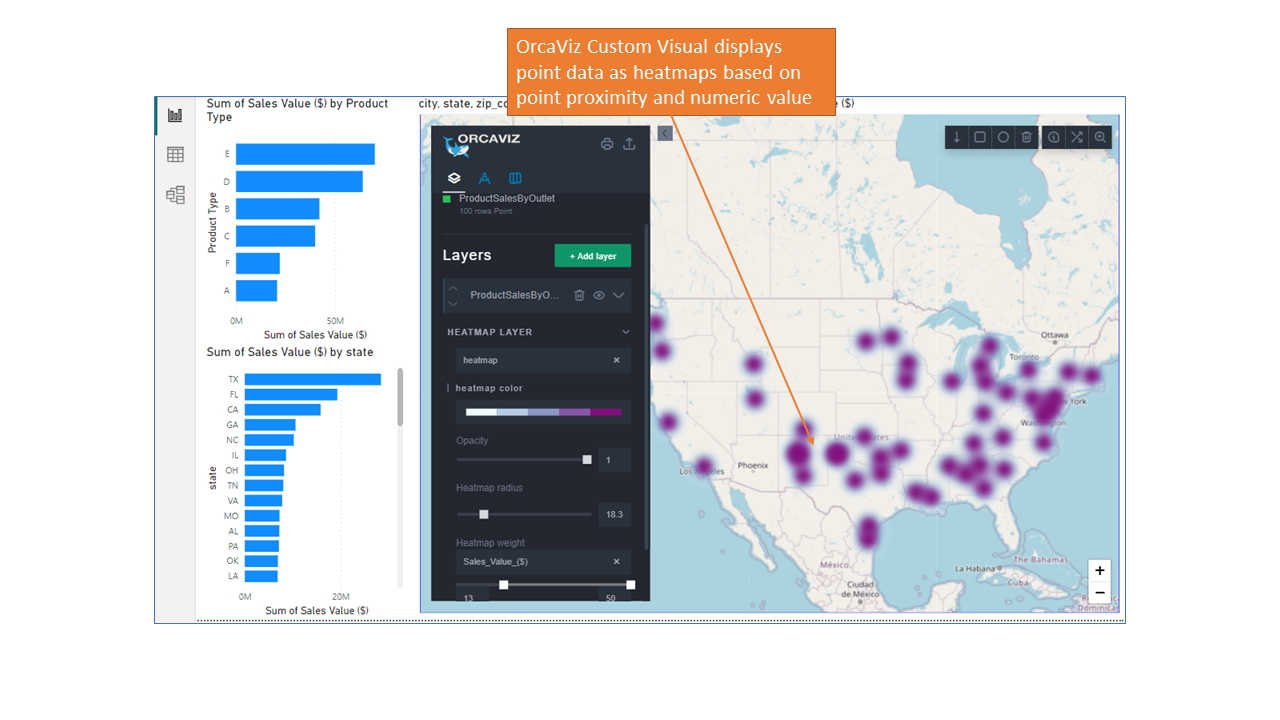
- Heatmaps based on proximity or a numeric value in the data
- Ability to create multiple layers on the map from the same dataset (pins, circles, heatmaps and text)
- Ability to change the order and visibility of each layer
- Ability to add multiple datasets on the same map enabling the relative scale and proximity to be understood
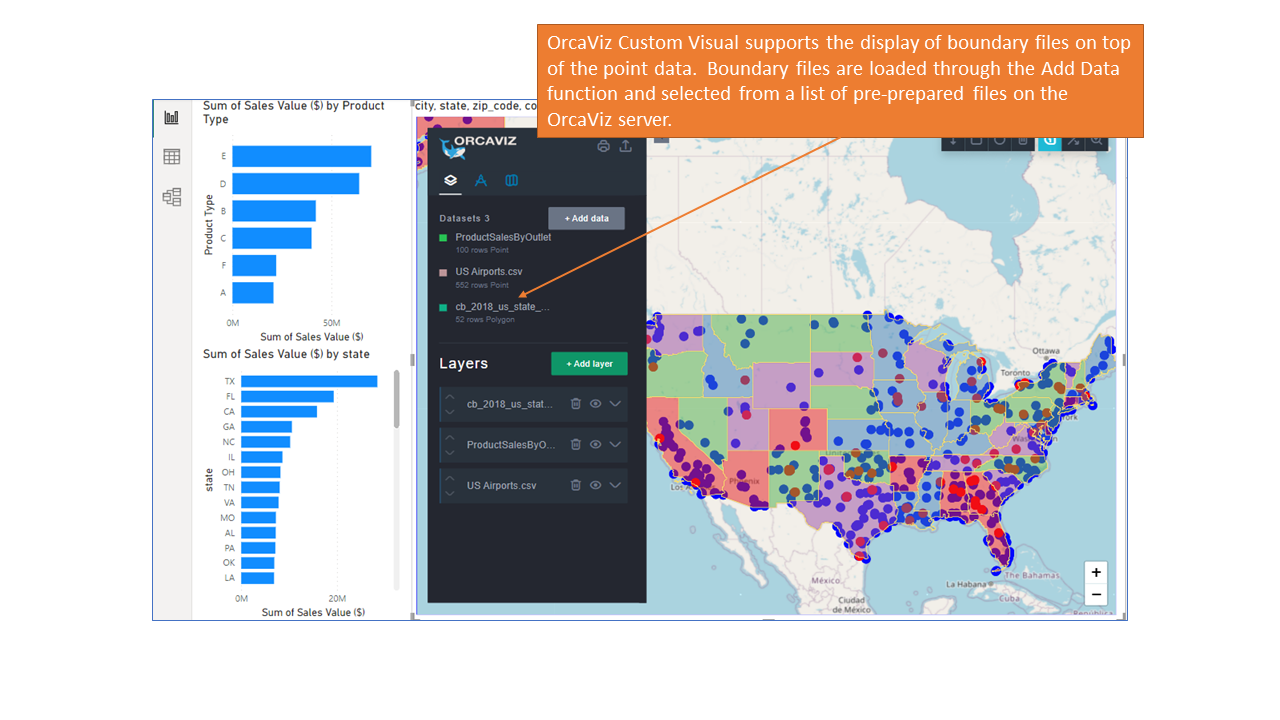
- Ability to overlay boundary shapes on the map
- Analytics to count or sum values of the data points within each shape and add the calculated values into the dataset
- Ability to colour the boundary shapes based on values within the data (including the calculated ones)
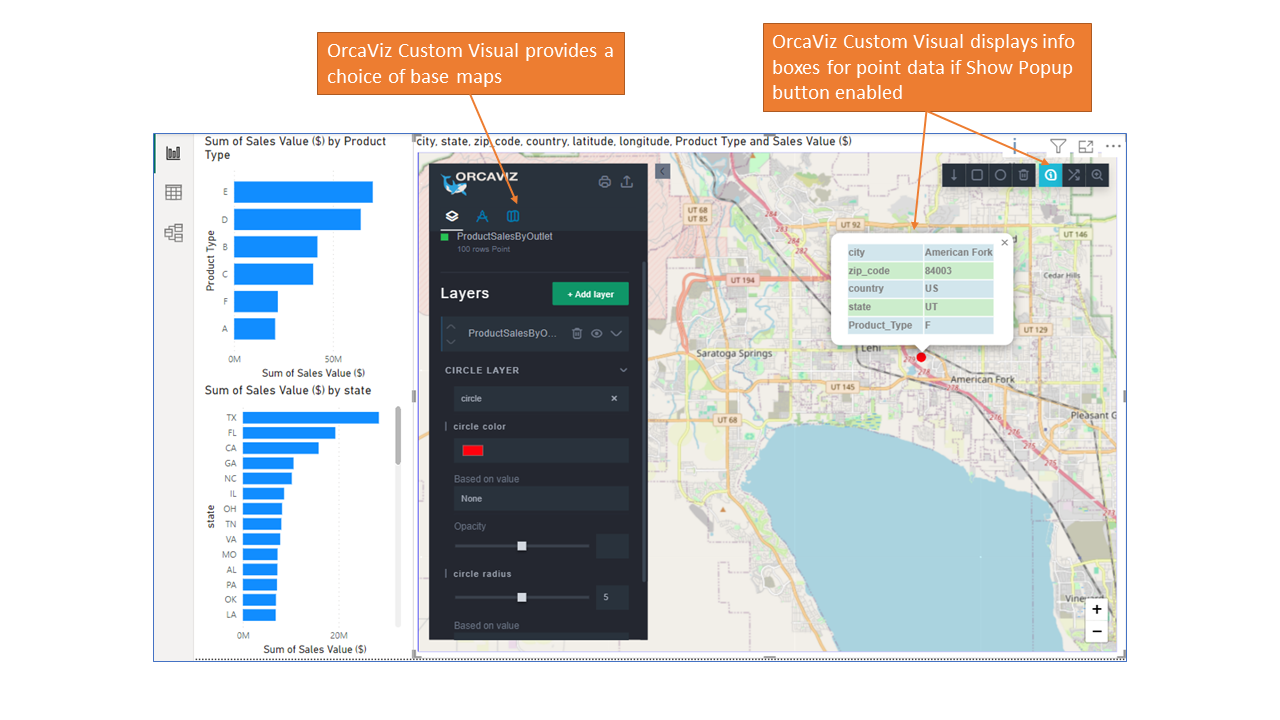
- Selectable base map layers (OrcaViz Pro only)
- Ability to cluster large datasets
- Ability to filter data shown on the map by any of the columns in the data (numeric or text)
- Filtering on the map will filter other visualisations on the same page (“cross filtering”) and vice versa
- Ability to click or hover over a data point (pin or circle) on the map and see the data associated with the pin
- Ability to customise the data viewable on hover or pin click
- Ability to move the pin if incorrectly positioned
- Selecting a pin will highlight the selection in other visuals on the page (“cross highlighting”)
- Supports PowerBi “Drill through” functions
- Allows the user to extract data from the map and create a new dataset comprising just the selected data
- Provides geocoding and validation functionality using an inbuilt geocoder (or Microsoft Azure Maps as well in OrcaViz Pro) to add latitude and longitude coordinates to the data (Azure Maps geocoder requires Azure Maps Geocoding API key)
- Allows the user to export any dataset in CSV, KML or Geojson format
Key Differentiators against competitors
OrcaViz provides an interactive rich mapping experience, providing core visualisations (circle, pins, heatmaps), fully integrated with PowerBi cross-filtering, cross highlighting and drill-through. Users can filter from the map component too. In addition to these, OrcaViz delivers extra functionality:
- OrcaViz allows multiple datasets on the same map. This overcomes a PowerBi constraint that restricts each map to show only one dataset. It is much easier to compare the proximity of multiple datasets if they appear on the same map. Additional datasets can be loaded from your desktop in a CSV format.
- OrcaViz enables the overlay of boundary data (states, countries etc)
- OrcaViz allows the user to extract data from the map using drawing tools (or imported shapes) and create a new dataset comprising just the extracted data.
- OrcaViz enables the export of the extracted data (as CSV, KML or Geojson), so the data can be added back into PowerBi or used elsewhere
- OrcaViz provides analytical functionality (when used with boundary shapes), to count the data points (or sum the values of the data points), falling within the shapes. The resultant calculation is added to the dataset and shapes can be coloured by these values.
- OrcaViz enables you to add latitude and longitude coordinates to your data within PowerBi, using the inbuilt geocoder or Azure Maps using your own geocoding API key (OrcaViz Pro only).
Gallery